The way you measure maintenance performance can take various forms, each of which can give you insight into your maintenance management processes. That said, collecting the right data is key to getting an accurate measure of your performance, as is putting it together in a way that is easily analyzed.
Sometimes, the best way to analyze data is to present it visually. In this article, we’ll show you how to do that for maintenance data.
Collect data with maintenance software
Maintenance teams have many ways of collecting performance data. Some of the most common include a CMMS, EAM software, and condition monitoring equipment.
CMMS
A computerized maintenance management system, or CMMS, is a common way to collect data about the performance of your maintenance team and assets you maintain . It centers around the creation and completion of work orders.
As such, a CMMS gathers information on types of work orders assigned, their completion, employee wrench time, assets worked on, and associated costs. When this data is compiled in a report, it allows you to see trends in your maintenance performance.
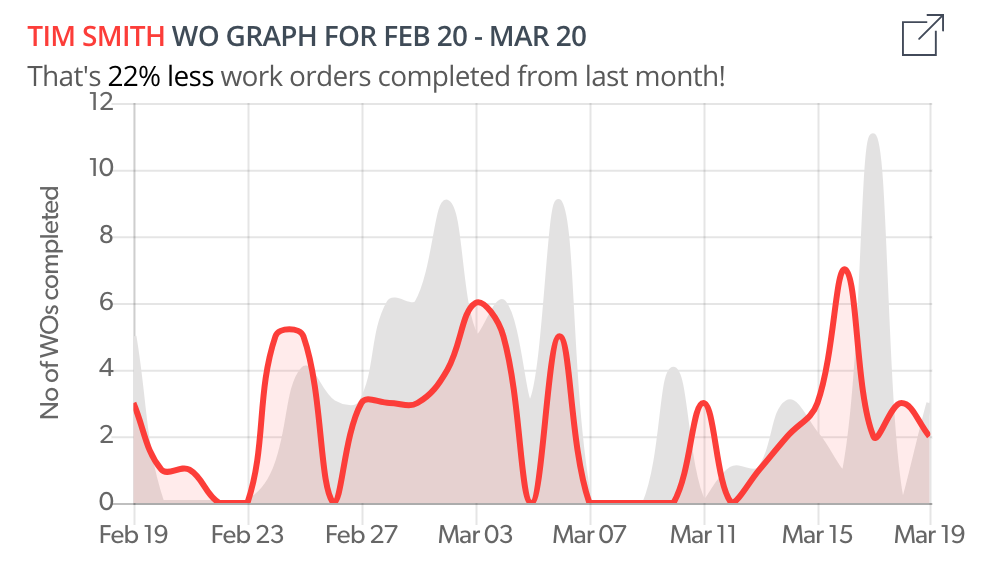
Graph: A visualization of monthly completed work orders for the technician Tim Smith within UpKeep’s CMMS. The red line shows the amount of work orders completed this month and the gray line shows the amount completed last month for quick comparison.
EAM software
Enterprise asset management (EAM) software tracks data throughout every stage of an asset’s lifecycle. The types of data you might pay special attention to include equipment downtime and asset depreciation. EAM software can also be connected to financial software to inform purchasing decisions based on an asset’s reliability.

Graph: A visualization of a molding machine’s financial data in UpKeep’s EAM portal. This specific graph shows the asset’s depreciation schedule using the straight line depreciation method.
Condition monitoring equipment
Predictive maintenance makes use of condition monitoring sensors. These sensors collect different types of data—such as vibration, sonic and ultrasonic acoustics, and infrared readings—to diagnose issues with individual assets. An abnormality in the data signals a problem, prompting an inspection work order.
The data gathered from monitoring equipment can help track the functionality of individual assets. This information in turn helps inform work orders, reliability analysis, and maintenance planning.
Reporting with maintenance software
Once data is collected and stored, it can be compiled into reports of various styles using maintenance software. Many CMMS programs allow you to compile data from work orders into reports that allow you to measure various key performance indicators (KPIs).
The data you choose to represent in your software will affect the kinds of conclusions you’ll be able to draw. For instance, a report including condition monitoring data would inform decisions about asset purchases, whereas wrench time data could help when fine-tuning maintenance management practices.
These programs also frequently include ways to visualize data as graphs. For instance, our own maintenance reporting software allows you to see data from work orders in a visual format, giving you a great deal of insight into your processes. Also, it’s simple to export data to your own custom dashboards and create detailed reports to track specific metrics.
Build custom visual reports with APIs
CMMS programs often come with APIs (application programming interfaces) that allow you to pull data from the program for use in other types of software. For instance, the ability to connect your CMMS software to financial applications like QuickBooks would rely on an API.
Business reporting tools can be used concurrently with CMMS programs to inform maintenance planning and foster collaboration with other departments. This software comes in many forms, and there are many free options out there.
Some of the most popular include:
Many companies prefer the power granted by paid APIs. For instance, some of our customers use Sisense, which is a tool that affords users the ability to quickly blend and analyze data, including information pulled from CMMS software.
We’ve also developed our own API for use with our maintenance management software. With this API, you can pull and aggregate data on various metrics, such as open work orders and average completion times.
The advantage of using an API is the ability to pull data into a program that specializes in generating reports. These programs include wide ranges of functionality, including the ability to compile data into numerous visual formats. The end result is the power to create your own fully customized reports, charts, and graphs based on pertinent data.
Maintenance performance from beginning to end
From initial data collection to creating visual reports, the ultimate goal of this process is to understand and improve your maintenance performance. By using reporting software or APIs to interpret CMMS data, your team can get a clear picture of what your performance looks like, where it’s lacking, and what you can do to make your maintenance processes more effective.