Blog Post
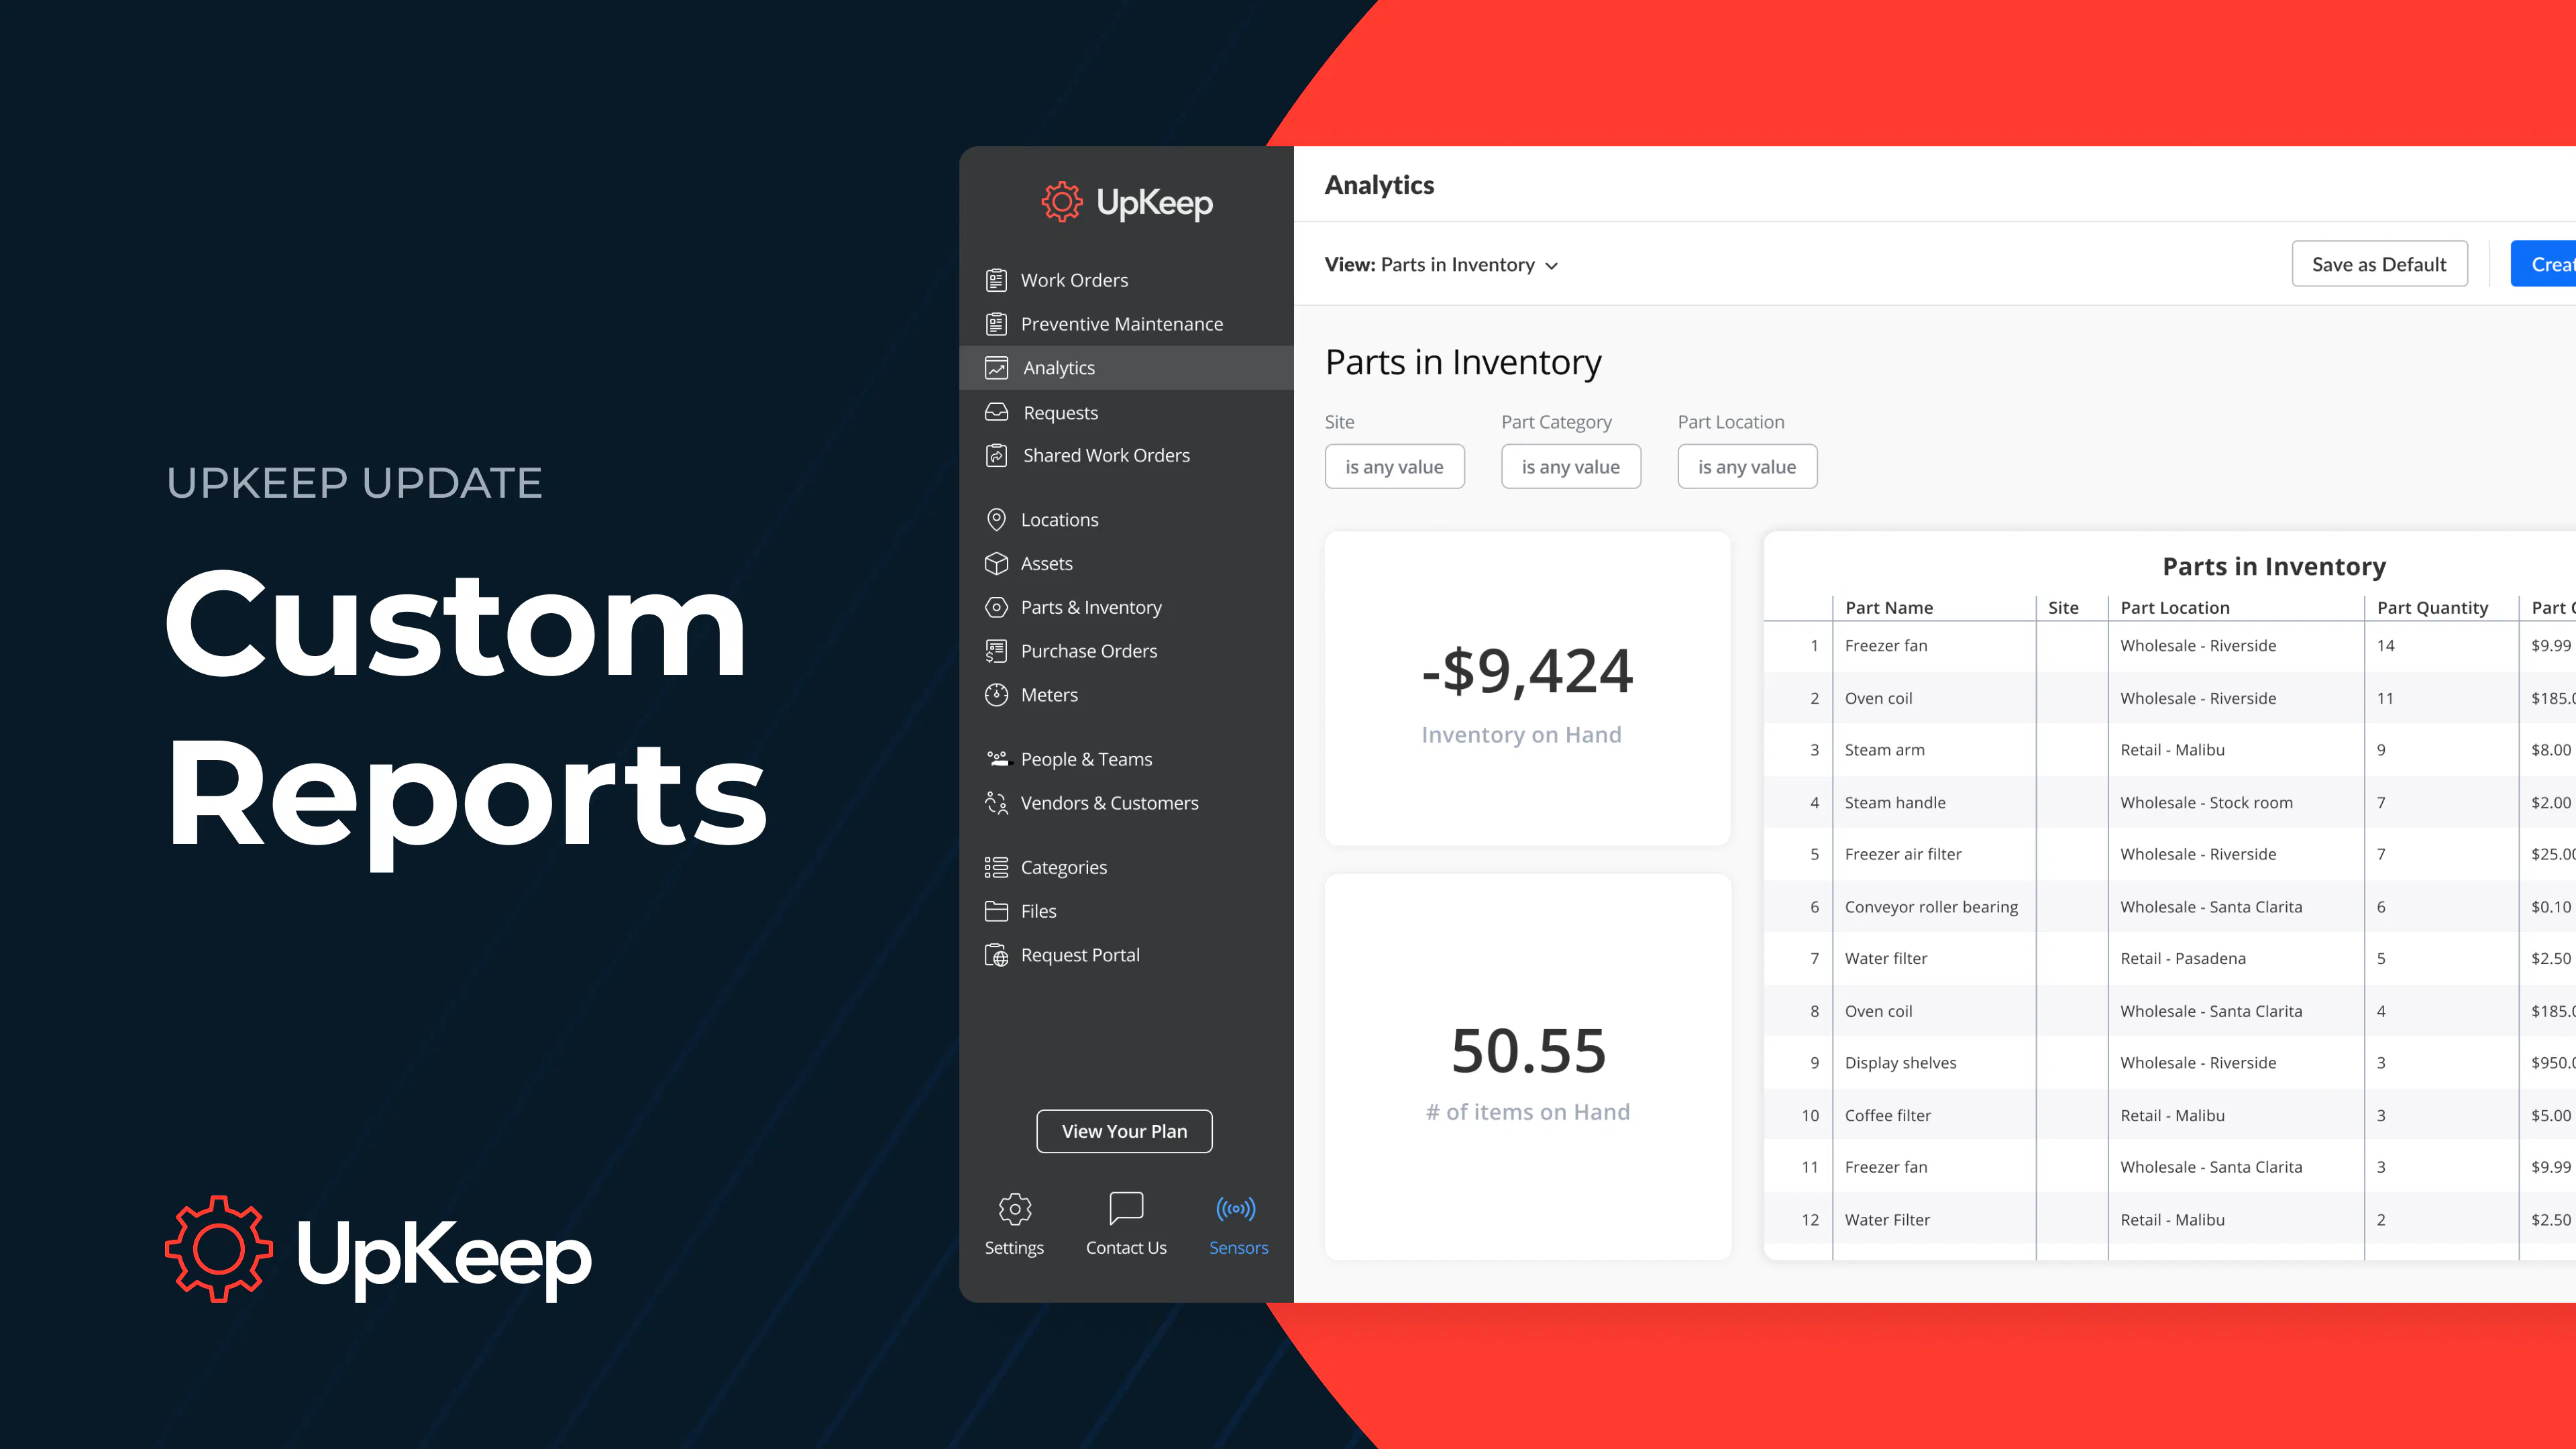
Custom Reports and Dashboards in UpKeep Analytics
Adding this customization better equips users to answer complex business questions, report on relevant KPIs to stakeholders, and explore data in new ways.


Today we’re happy to announce the launch of our Custom Reports functionality for UpKeep Analytics! This functionality allows administrators to create custom dashboards using the data within UpKeep such as:
Work orders
Asset data
Tasks
Meters
Requests
People and teams
Adding this customization for our Business Plus users better equips them to answer complex business questions, report on relevant KPIs to stakeholders, and explore data in new ways.
Industry-Best Business Intelligence
No two companies are the same when it comes to the data that matters most. This is why it was important for us to give users the ability to create or customize their own dashboards. With our new Custom Reports functionality, users can easily move beyond fixed dashboards to grow their business intelligence.
Additionally, opening the explore features allows users to not only see all relevant data, but also to visualize it in unique ways. There are over 15 visualizations to choose from when creating reports. You can keep these reports private or share them across the organization. Sharing is made even easier by the ability to download the data/visualizations in CSV or PDF format.
Some possible sample reports include:
Checklists/tasks included in preventive maintenance inspections or work orders
Cycle counts for parts inventory
Parts awaiting fulfillment from purchase orders
Our industry-leading business intelligence tools are powered by Google and Looker, ensuring that our customers are getting best-in-class tools coupled with our industry-leading Asset Operations Management platform. For more details on how to build a custom dashboard in UpKeep, check out our help desk article: How to Build a Custom Dashboard
Identify Maintenance Trends
With the Custom Reports functionality in UpKeep Analytics, users can view consumption costs, parts consumed, and consumption trends month over month. Having this visibility prevents unnecessary costs and shows exactly what’s in your inventory at any moment.
Understand Breakdowns More Clearly
See where maintenance teams are dedicating their time and determine the most common types of equipment failure. Uncovering breakdown trends, and implementing preventive maintenance schedules from them, allows companies to achieve the full useful life of their assets.
Not Just Standard Reporting
Are you looking to:
Move beyond fixed dashboards?
Reduce costs and time spent on work orders?
Better showcase your team’s research and findings?
Achieve the full useful life of your assets?
With a Business Plus plan, you can easily create comprehensive reports, build your own dashboards, and leverage all the data your team generates to gain essential insights. It’s your passport to next-level reporting.
Visit our UpKeep Analytics page to learn more about our best-in-class data engine!
4,000+ COMPANIES RELY ON ASSET OPERATIONS MANAGEMENT
Leading the Way to a Better Future for Maintenance and Reliability
Your asset and equipment data doesn't belong in a silo. UpKeep makes it simple to see where everything stands, all in one place. That means less guesswork and more time to focus on what matters.