Downloads
The Ultimate Guide to Maintenance Metrics & KPIs
Data-driven decision-making is what fuels world-class maintenance teams. But with so many possible metrics to track, how do you choose the right metrics for your team? In this guide, we'll take you through the necessary topics to get your metrics & KPI measurement set up for success .
Unlock Your All Access Pass
Introduction
Most organizations are aware of how important it is to use data in their decision making. Maintenance teams are no different. If you have the right data, you’ll be able to make more sensible decisions. The challenge comes in choosing which metrics to track.
Choosing the right metrics helps you prioritize the right tasks and align your goals with those of other departments. Therefore, tracking maintenance metrics is a vital component of achieving world-class maintenance in your organization.
When you select the best key performance indicators (KPIs) for your organization, you can find ways to reduce downtime and boost revenue. By limiting yourself to only the most important KPIs, you aim for world-class performance.
This is UpKeep’s guide to the key metrics and KPIs that are critical for any facility to identify. We’ll discuss overviews, formulas, strategies, and tips for pinning down the right metrics to track for your maintenance team.
Terminology
What Is a Metric
A metric is any number your organization might track. Each metric has its uses, and some may be more useful for marking progress than others, but all of them should give you some insight into what goes on in your processes.
For example, preventive maintenance schedule compliance may not tell you much about the company’s profitability as a whole, but it does provide insight into how your maintenance processes are going.
What Is a KPI?
A key performance indicator (KPI), on the other hand, is a metric that provides
insight into your organization’s performance as a whole. Ideally, they’re linked with business goals.
For instance, a manufacturer striving for top customer satisfaction will likely use customer rejects and satisfaction as key performance indicators. However, planned maintenance percentage and other maintenance metrics will likely be less useful here.
What Is the Difference Between Metrics and KPIs?
Metrics and KPIs are similar, as they both measure your company’s performance against particular goals. Both look at current performance or measures, establish ideal levels for the future, and work toward those goals. The major difference is that metrics are a measurement of progress toward a goal; KPIs are target numbers to hit.
What Are Leading and Lagging Indictators?
Metrics and KPIs are generally classified according to whether they predict future performance or describe past performance. These are referred to as leading or lagging indicators, respectively.
Leading Indicators
Leading indicators are measurements that predict the outcome of a process or an event. These indicators are measured and are considered to be precursors of events or situations.
An example of a leading indicator is schedule compliance, when regarded as an indicator of the likelihood that an asset will experience unplanned failures and downtime. Because schedule compliance describes the amount of planned maintenance activities done on time, it can be correlated with how effectively maintenance activities are carried out, and therefore relate to increasing reliability.
Similarly, the metric planned maintenance percentage can be considered a leading indicator as it affects the amount of unplanned downtime by aiming to keep assets running at optimal health. It also affects the required manpower as planned maintenance activities can be more efficiently scheduled.
"Leading KPIs lead to results; lagging KPIs are the results. If you are managing maintenance without accurate leading and lagging KPIs, then you are lost." -Ricky Smith, UpKeep Expert in Residence
Lagging Indicators
Lagging indicators measure the performance of the plant by looking at the outcomes and results of processes and operations. By analyzing the historical trend of the performance of the plant and its parts, reactive strategies can be applied to address underlying issues.
Examples of lagging indicators include mean time to repair (MTTR), mean time between failure (MTBF), and overall equipment effectiveness (OEE). Notice how these metrics are measured to confirm trends that have developed over time. Because these metrics are basically a historical record of performance, they can provide insights on which events in the past might have caused fluctuations to the plant’s performance.
5 Considerations for Chooosing Metrics to Track
When it comes to maintenance planning, you will likely focus on both lagging and leading indicators—the former to show your progress, and the latter to manage root causes. But as explained, choosing the right ones to track can be a challenge. How do you know what’s worth tracking? These considerations may help in the decision-making process.
1. What Are Your Organization's Goals?
For starters, consider your goals. These can be any goals from your organization. For example, if your goal is to increase production, you’ll need some metrics around maintenance to ensure that you’re hitting your availability targets.
Of course, at lower levels, your goals would get more specific. In a manufacturing plant, for instance, you might have a goal to increase your conveyor system’s uptime by a certain percentage. With that goal in mind, you’ll be able to start looking at which leading indicators would support that. Make a list of possibilities to get started. Your list might include your preventive maintenance (as a percentage of total maintenance), your schedule compliance for the preventive maintenance, and your maintenance backlog.
2. What Are You Already Tracking?
When you have an idea of which indicators might help you meet your overall goals, determine what you’re already tracking and start there. For some metrics, you’ll need some time to get enough data to make it truly meaningful. As such, using those wouldn’t be as economical as pulling from existing data.
In our conveyor system example, if you’re already tracking preventive maintenance but not other metrics, start with that one. If you’re not tracking schedule compliance or work order backlogs, you can’t use those until you do, and getting that data together would take extra time.
At the end of the day, it’s a return on investment calculation. What’s the benefit and cost of tracking the metric? If that ratio is large enough (or at a minimum, the benefit outweighs the cost), then you should consider tracking it. But be careful with over-tracking metrics. Many companies track metrics but never use them for anything. Ask yourself these questions:
What are you planning to use this for?
What actions are you going to drive?
What does this help you understand about your business?
3. What Type of Assets Are You Tracking?
The matter of which type of assets you’re tracking is another important consideration. Different assets have different needs and purposes, and what would make sense for one might not be right for another.
For example, if you’re tracking a mission-critical mixer, you’ll likely want to focus on preventive maintenance, mean time to repair, and other such metrics. For something less important like lightbulbs in the men’s bathroom, you’re probably not too interested in the time it takes to replace those. Instead, measurements such as stockouts or other inventory metrics would be more relevant.
4. How Critical Is the Asset?
Criticality, of course, should always enter into your decisions on what metrics to track. A non-critical piece of equipment wouldn’t be as important to track as one that’s core to your process.
If an asset is at high risk of failure, and if that failure would have a significant impact on your process, you’ll want to track it more carefully by monitoring leading indicators. For an asset that’s less likely to fail and that wouldn’t cause a significant disruption if it went down, surface-level monitoring with lagging indicators might be more appropriate.
Risk is also important. If it’s low-critical equipment, but it fails multiple times daily, the risk is very high. Small, chronic failures are a big issue in manufacturing.
5. Cause and Effect Relationships
The last consideration is a matter of cause and effect. When choosing leading indicators, you’ll need to determine whether they truly have an impact on your desired results. After all, metrics are only of any value if they are predictive in nature.
Often, finding whether a given metric is truly predictive of future success is a matter of trial and error. You start tracking the data, and then see if lagging indicators correlate with it.
Existing studies can also help you pin down cause and effect relationships. Back to our conveyor system example, studies show that preventive maintenance provides 12% to 18% cost savings over reactive maintenance, meaning there’s a good chance that tracking and improving preventive maintenance as a metric would help reduce unplanned downtime.
"Maintenance metrics and KPIs to our organization aren’t just a tool to evaluate our technician teams; they set the benchmark in which we build and modify processes, plan future decisions, and improve our operations upon. KPIs are a direct look into the important details and trends that are sometimes hidden by the day-to-day rhythm."
Types of Maintenance Metrics
Not every maintenance metric is of equal importance to every company. Metrics
that qualify as KPIs are dependent on your industry, your company’s goals, and the types of assets you manage. When you select the best metrics and KPIs for your organization, you can find ways to reduce downtime and boost revenue.
Instead of placing equal importance on every metric you track, choose a few KPIs. You can also choose a few leading indicators that help you determine why KPIs are getting hit or being missed. For instance, if schedule compliance is a KPI, percentage of work covered by a work order may be a leading indicator.
Below, we explore different maintenance metrics that you can track as KPIs and leading indicators.
Equipment Downtime
Overview
Equipment downtime refers to the amount of time that equipment is not operating, whether that’s a result of unplanned equipment failure (like a fault or broken part) or planned downtime (like necessary downtime for preventive maintenance). Typically, the term equipment downtime refers to unexpected downtime that accumulates any time the production process stops.
World-Class Standard
Aim for unscheduled downtime to be 10% or less, meaning that a facility’s equipment should be running at 90% availability or greater.
Why It's Important
Tracking equipment downtime is particularly important for a few reasons. Having a good idea of a facility’s typical uptime works as a diagnostic tool for the facility’s maintenance and production efforts. For example, a high equipment downtime figure might mean that preventive maintenance isn’t being performed properly, or that there are problems with how production is set up. On the other hand, a low maintenance downtime figure can indicate a generally healthy production environment.
This can be even more granular if equipment downtime is tracked on a per-area basis. If downtime is especially high in the final assembly portion of a production line, it’s clear where improvements need to happen. In this way, tracking downtime becomes a method of mapping out the overall health of each individual part of an organization’s production. While it can seem expensive to track downtime with a computerized maintenance management system (CMMS), there’s a potentially far larger amount of money saved on knowing where issues lie and eliminating them.
How to Calculate (Hrs of downtime / total period measured) * 100
Because the term equipment downtime can apply to any event that halts manufacturing, it’s important for an organization to first figure out what kind of downtime they want to calculate.
Maintenance Backlog
Overview
Usually measured in work days or weeks, the maintenance backlog as a metric quantifies the amount of time required for a defined number of workers to complete all pending maintenance tasks. Maintenance backlog is composed of activities related to preventive maintenance and any other outstanding maintenance such as required corrective maintenance.
It goes without saying that not all tasks in the backlog are equally urgent. Having some backlog is not necessarily a reason to panic—it can even be an indicator of optimized staffing. The dangers of maintenance backlog creep in when maintenance schedules are disrupted by emergency work and an inefficient prioritization model.
Neglected tasks in the maintenance backlog become deferred maintenance, inevitably causing more breakdowns and serious downtime. Breakdowns require immediate unplanned maintenance tasks that in turn disrupt scheduled activities. Disruptions to the schedule push more tasks into the backlog to continue the vicious cycle.
World-Class Standard
Aim to have a maintenance backlog of around six weeks worth of tasks per technician.
How Much Backlog Is Too Much?
Maintenance backlog provides a list of things to do over a certain period of time. Having some amount of backlog is generally acceptable. Having no backlog may be indicative of overstaffing. The idea is not to eliminate the backlog but to manage it.
The exact ideal amount of backlog may vary for each business, but the idea remains that some amount of pending work can be a useful metric when managed properly.
The important point in measuring maintenance backlog is defining how it’s measured. Agree with the team and with your stakeholders on what constitutes the maintenance backlog.
How much of it is preventive maintenance, and how much of it is corrective maintenance? Differentiate between tasks and delegate maintenance work accordingly, so that the workforce is utilized more effectively towards managing the backlog.
Mean Time Between Failure (MTBF)
Overview
Mean time between failure (MTBF) as a maintenance metric indicates the duration that an equipment operates without disturbances. This intuitively relates to the availability of the equipment. Availability, also known as uptime, is one of the key indicators of overall equipment effectiveness and is always a focus area for improving productivity. An equipment’s total uptime can be expressed in terms of the MTBF together with another metric,
the MTTR (mean time to repair).
It is important to note that MTBF is applicable only to repairable items. Manufacturing processes can use it to plan for contingencies that require the repair of key equipment. Being aware of this data provides insights for making sound decisions for the plant. There’s also mean time to failure, which is for non-repairable equipment.
World-Class Standard
Varies based on equipment type.
How to Calculate MTBF
The MTBF is calculated by taking the total time a piece of equipment is running (i.e. uptime) and dividing it by the number of breakdowns that occurred over the same period.
MTBF = total uptime / # of breakdowns
How to Improve MTBF
Increasing the MTBF increases the uptime of equipment. Keeping track of the MTBF for each piece of equipment, especially those that require continuous operation, allows the maintenance team to efficiently schedule maintenance activities.
The first step to improving MTBF is to make sure that the data being collected is accurate. Development of tools such as various maintenance software can ensure that data is being recorded correctly and accurately.
The next step to gathering data is using it to proactively perform preventive maintenance. Investing the time to perform maintenance checks and activities such as checking for proper lubrication, aligning calibration systems, and cleaning pays off by significantly reducing the number of major stoppages due to breakdowns.
"A key and fundamental metric for my organization is corrective work generated from preventive. This is quantified by task fail work order generation and viewed as a percentage of overall work orders. This fundamental process keeps the technicians engaged in fail finding at the right time during schedule service."
Mean Time to Repair (MTTR)
Overview
Mean time to repair (MTTR) is the average time it takes for equipment to be diagnosed, repaired, and recovered after experiencing a failure. It’s a metric that is used to assess maintenance effectiveness.
One of the factors that contributes to a plant’s overall equipment effectiveness is the availability of the equipment to perform its functions. When equipment experiences downtime, especially due to failures, its availability is negatively impacted and therefore reflects poorly on the overall productivity of the system.
By keeping a data-driven mindset and proactively improving the MTTR, the manufacturing processes can reduce availability losses due to repairs. The idea is to speed up the equipment’s rate of recovery from failures and breakdowns. Minimizing the MTTR values of equipment is a step towards maximizing a plant’s productivity.
World-Class Standard
Though diligence in noting reliability and availability data has improved over the years, the method of measuring metrics such as MTTR has no clear industry standard.
Keeping in mind potential inconsistencies in recording data, it’s important to always define the methodology by which variables within the operations are measured. This provides a transparent guide for internal teams and external stakeholders alike.
How to Calculate MTTR
The MTTR is equal to the average duration of each stoppage due to failure. This is calculated by taking the total downtime that goes into the repair and recovery of equipment, divided by the number of times that the same equipment has stopped its operations.
MTTR can be written in the form of the formula: MTTR = total downtime / # occurrences of stoppages
Note that the MTTR formula in itself is not dependent on the span of time in which the equipment operates (i.e. uptime). MTTR is only quantified by the average time each stoppage lasts, regardless of the period between the instances of downtime.
How to Improve MTTR
The most effective way to reduce MTTR is to get to the root cause of the failure before it even occurs. Closely monitoring operational data of each piece of equipment in the plant enables the early detection of possible causes of failure. In today’s setting, these tasks can be completed more easily and accurately with tools such as CMMS software.
Performing preventive maintenance on equipment addresses most issues that eventually lead to major breakdowns. When equipment is routinely scheduled for inspection and maintenance work, points of failure are identified early, and the resulting MTTR is relatively short.
Another way to improve MTTR and increase availability is to map out and plan ahead for possible breakdown scenarios. Anticipation of possible breakdown causes can better equip the team with efficient solutions to quickly resolve issues.
The MTTR formula in itself is not dependent on the span of time in which the equipment operates (i.e. uptime). MTTR is only quantified by the average time each stoppage lasts, regardless of the period between the instances of downtime.
Overall Equipment Effectiveness (OEE)
Overview
Overall equipment effectiveness (OEE) is a standard used for measuring plant performance. Calculating a plant’s OEE helps identify areas that are holding the plant back from performing at
maximum capacity.
World-Class Standard
Three main factors drive a plant’s performance: availability, performance efficiency, and rate of quality products. Seiichi Nakajima, who conceptualized and introduced OEE, provides ideal scores for each of these factors to achieve a world-class OEE rating:
Availability > 90%
Performance efficiency > 95%
Rate of quality products > 99%
Aim to have an OEE of 77% or greater.
How to Calculate OEE
To calculate OEE, three main factors need to be defined and quantified:
Availability
Availability quantifies the amount of time that equipment is able to perform its function. It’s calculated as the ratio of the actual operation time to the available time per day, where the available time per day is equated to a full working shift.
Availability = (available time - planned downtime) / available time
Performance Efficiency
Performance efficiency quantifies how much longer it takes to complete a process compared to its ideal cycle time.
A simplified calculation is taken by multiplying the number of processed units by the ideal cycle time, then dividing the product by the actual operation time.
Performance efficiency = [(# processed units * ideal cycle time) / actual operation time]
Rate of Quality Products
Rate of quality products quantifies how much of the total produced units are within the acceptable standards of good quality.
For a batch of 440 units produced with only 435 units of acceptable quality, the rate of quality products is calculated to be 97.73%.
Rate of quality products = (# units of acceptable quality / # units produced)
Overall Equipment Effectiveness
The OEE is then calculated by taking the product of its three main factors.
OEE = availability * performance efficiency * rate of quality products
How to Improve OEE
Being aware of the factors contributing to the OEE allows for proper planning to proactively reduce process inefficiencies and losses. Clearly, improving one or all of the factors will in turn improve the OEE of the plant.
A good start to boost the plant’s effectiveness is to eliminate the “six big losses” that every manufacturing unit should be aware of.
Each of these six points directly impact at least one of the factors that constitutes the overall effectiveness. Addressing these losses will inevitably lead to an improved OEE.
Avoid Equipment Failure
Refers to mechanical breakdowns of key equipment, or generally any unplanned downtime that can cause a significant decrease in availability
Expedite Setup and Adjustment
A period of reduced or stopped activity (usually planned) when equipment is being set up and adjusted (e.g. system preparations, warmup, maintenance)
Minimize Idling and Minor Stoppages
Minor interruptions in production that can cause unnecessary increases to the production time
Troubleshoot Reduced Speed
Occurs when equipment is running at increased cycle times that vary too much from ideal levels
Minimize Defects in Process
Any errors along the processing flow that add flaws to the finished product, and therefore a decrease in the number of quality products
Prevent Reduced Yield
Occurs when equipment is not working under the optimal conditions to produce products within the acceptable quality standards (e.g. units produced while the equipment has just started running or is being set up)
Planned Maintenance Percentage (PMP)
Overview
Planned maintenance percentage (PMP) is a percentage that describes the amount of maintenance time used towards planned maintenance tasks, which is measured against the total amount of maintenance hours in a given time period (weeks, months, years).
The PMP metric exists because it’s useful for organizations to track how their maintenance time is spent. While a planned maintenance percentage shows an organization how much time is spent performing planned maintenance, it also shows how much time
is spent fixing reactive/corrective issues and unplanned downtime events.
Calculating a facility’s PMP is a useful way of determining what issues need to be combated. For example, if the PMP is low (which means a small amount of maintenance hours is being spent on planned maintenance), there could be a problem with production equipment that’s keeping it from functioning at an appropriate level. In this way, PMP is not only a measurement tool for planned maintenance efficiency but also a diagnostic tool.
World-Class Standard
Aim to have a planned maintenance percentage of >85%.
How to Calculate PMP
You can calculate PMP with following equation: (Planned maintenance hours / total maintenance hours) * 100
Schedule Compliance
Overview
Organizations that are committed to measuring the effectiveness of their scheduled maintenance process use schedule compliance as a performance metric. Maintenance activities are typically scheduled over the course of one week, and schedule compliance is measured over the same period, although time periods may vary by organization. It’s critical that managers create a formal process that promotes periodic review of results and open discussion for areas of improvement.
Manufacturing organizations benefit the most from tracking schedule compliance when properly implemented. By definition, the organization is required to proactively create a work schedule
to adhere to. In manufacturing plants, scheduled maintenance typically means machine downtime which forces close communication and coordination between schedulers, operators, mechanics, and other plant personnel.
World-Class Standard
Aim to have 90%+ schedule compliance.
4 Tips for Implementing Schedule Compliance
A strategy on implementing schedule compliance properly could mean the difference between acceptance or backlash.
Define the Purpose
We have established what schedule compliance is and how it’s a critical metric used to improve reliability and productivity. When you present this metric, get specific on what reliability and productivity mean and how all personnel benefit from improving them.
Gain Alignment
Get buy-in from leadership at all levels. Educate and empower supervisors and managers on how to respond to any concerns or objections from employees. A common concern can be the time frame involved in calculating compliance. Maintenance teams that have too many “emergencies” will not agree to shorter time frames as they are less likely to be able to comply with scheduled work. It will be up to management to decide how to properly implement schedule compliance in a way that does not de-motivate personnel.
Encourage Transparency
The true test to your culture will come once you have data to analyze and start asking the “why” questions. Condition your teams to have uncomfortable conversations. If transparency is new to your organization, consider recognizing or rewarding behaviors that support your new need for candor. A technician that does not finish a task on time may one day admit he has not fully understood how to calibrate the new piece of equipment. How his supervisor responds to this will either encourage or discourage more of the same honest behavior.
Get Feedback Along the Way
Your formal plan for measuring schedule compliance must include a way of collecting input from all employees. Having a mechanism that allows personnel to proactively give input or ideas enables management to evaluate and make adjustments. It also tells employees that the organization is listening to them.
Other Important Maintenance Metrics
Maintenance cost as a percentage of RAV is a metric that shows how cost-effective your maintenance efforts are, where RAV stands for replacement asset value. One percent is considered world-class.
Average days to complete work orders may be used to determine whether a maintenance team is becoming more productive. However, this should be measured alongside failure-related metrics to ensure that faster maintenance doesn’t result in more failures.
Percentage of work covered by a work order shows how much maintenance activity you’re logging in your maintenance software. In addition to helping measure data acquisition efforts, this metric also measures a maintenance team’s degree of organization. The goal is to reach 100%.
Maintenance overtime helps you understand whether you need more people on your maintenance team. Having a little overtime is good, but having too much can lead to employee burnout and excessive labor costs. The goal is to achieve around 5%.
"There was a lack of discipline around metrics. We had a very good standard, but not a lot of people knew about it or took the time to learn the contents, which resulted in a misunderstanding of metric definitions, calculations, and how they should be used. It also seemed like metrics drove reactive behaviors and siloed competition where different areas of the business would do what was necessary to make their metrics look good, but at the detriment of another area’s metrics."
Formula Guide
Equipment Downtime
[(Hours of downtime / total period measured) * 100]
Mean Time Between Failure
MTBF = total uptime / # of breakdowns
Mean Time to Repair
MTTR = total downtime / # occurrences of stoppages
Overall Equipment Effectiveness
OEE = availability * performance efficiency * rate of quality products
Availability = (available time - planned downtime) / available time
Performance efficiency = [(# processed units * ideal cycle time) / actual operation time]
Rate of quality products = (# units of acceptable quality / # units produced)
Planned Maintenance Percentage
(Planned maintenance hours / total maintenance hours) * 100
Conclusion
Metrics and KPIs are the critical measuring sticks to help keep your facility up and running and operating efficiently. By selecting a handful of metrics and KPIs, your management team can make changes and measure their effectiveness.
Choosing the right metrics is a process that depends on the asset, its criticality, and your business objectives. Sometimes you have strong research to support choosing particular metrics. In other instances, you might need to do some trial and error to find out what’s really worth measuring. In either case, as you choose the right metrics to track, you’ll improve your maintenance planning and help your maintenance team become more efficient.
Want to keep reading?


Maintenance
Cultivating Maintenance Excellence: The Role of Culture and Leadership in Reliability

Maintenance
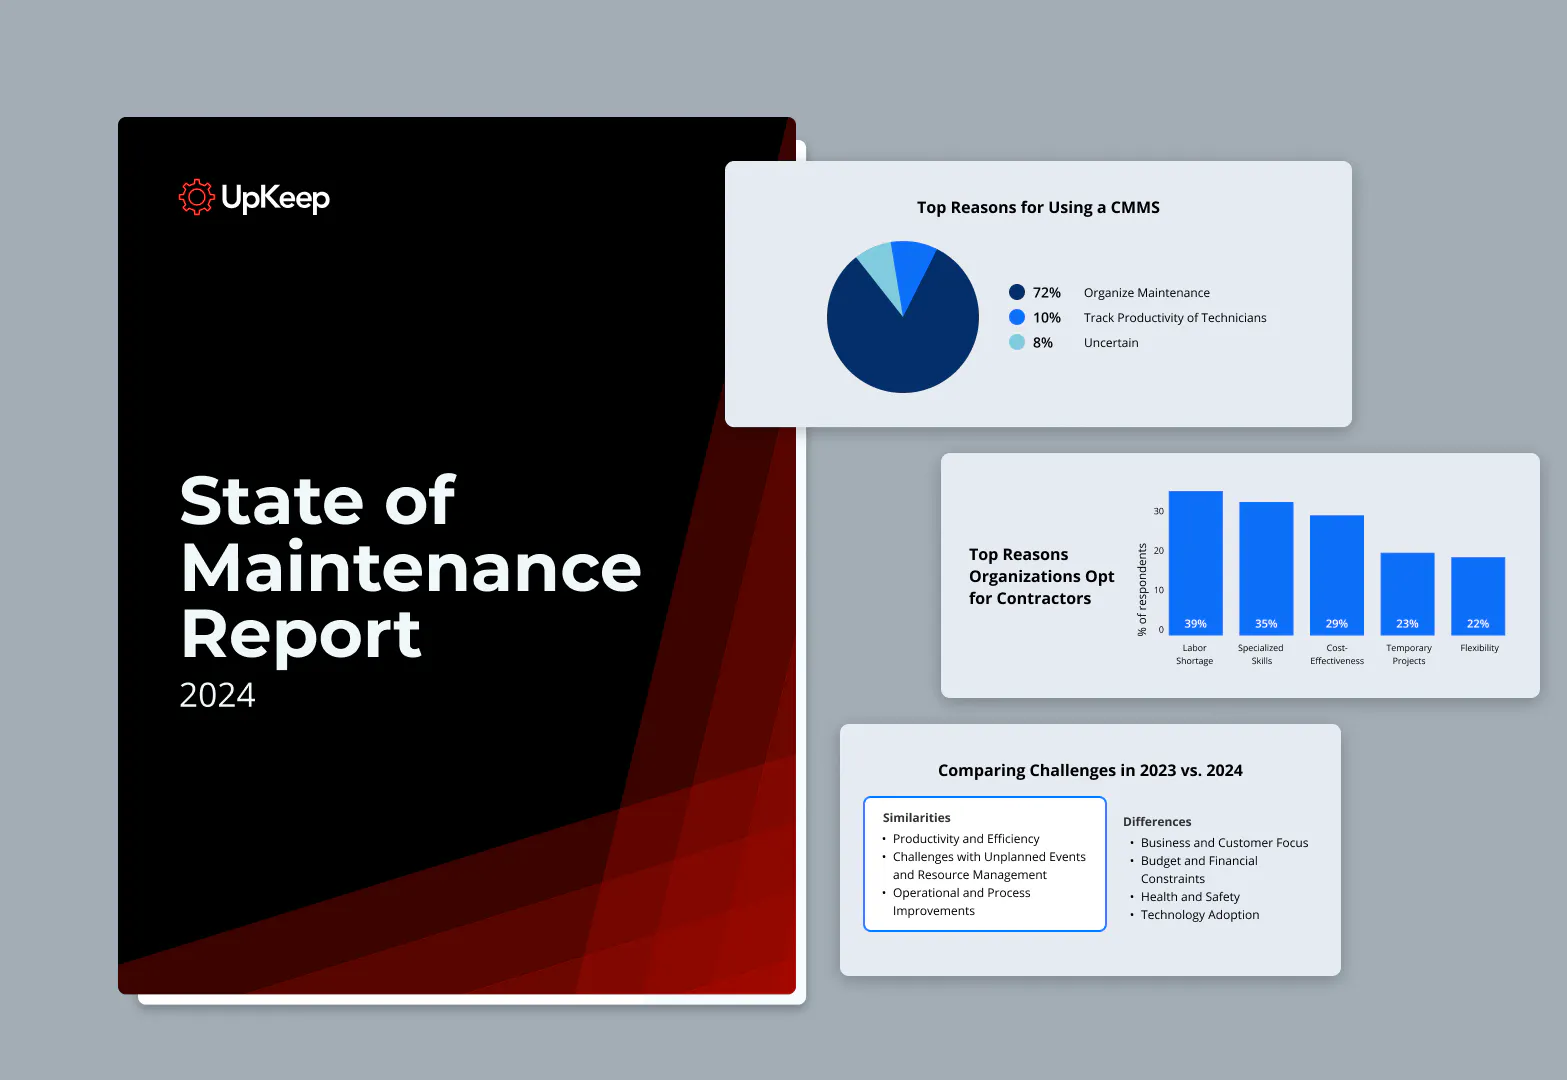
State of Maintenance Report 2024

Maintenance
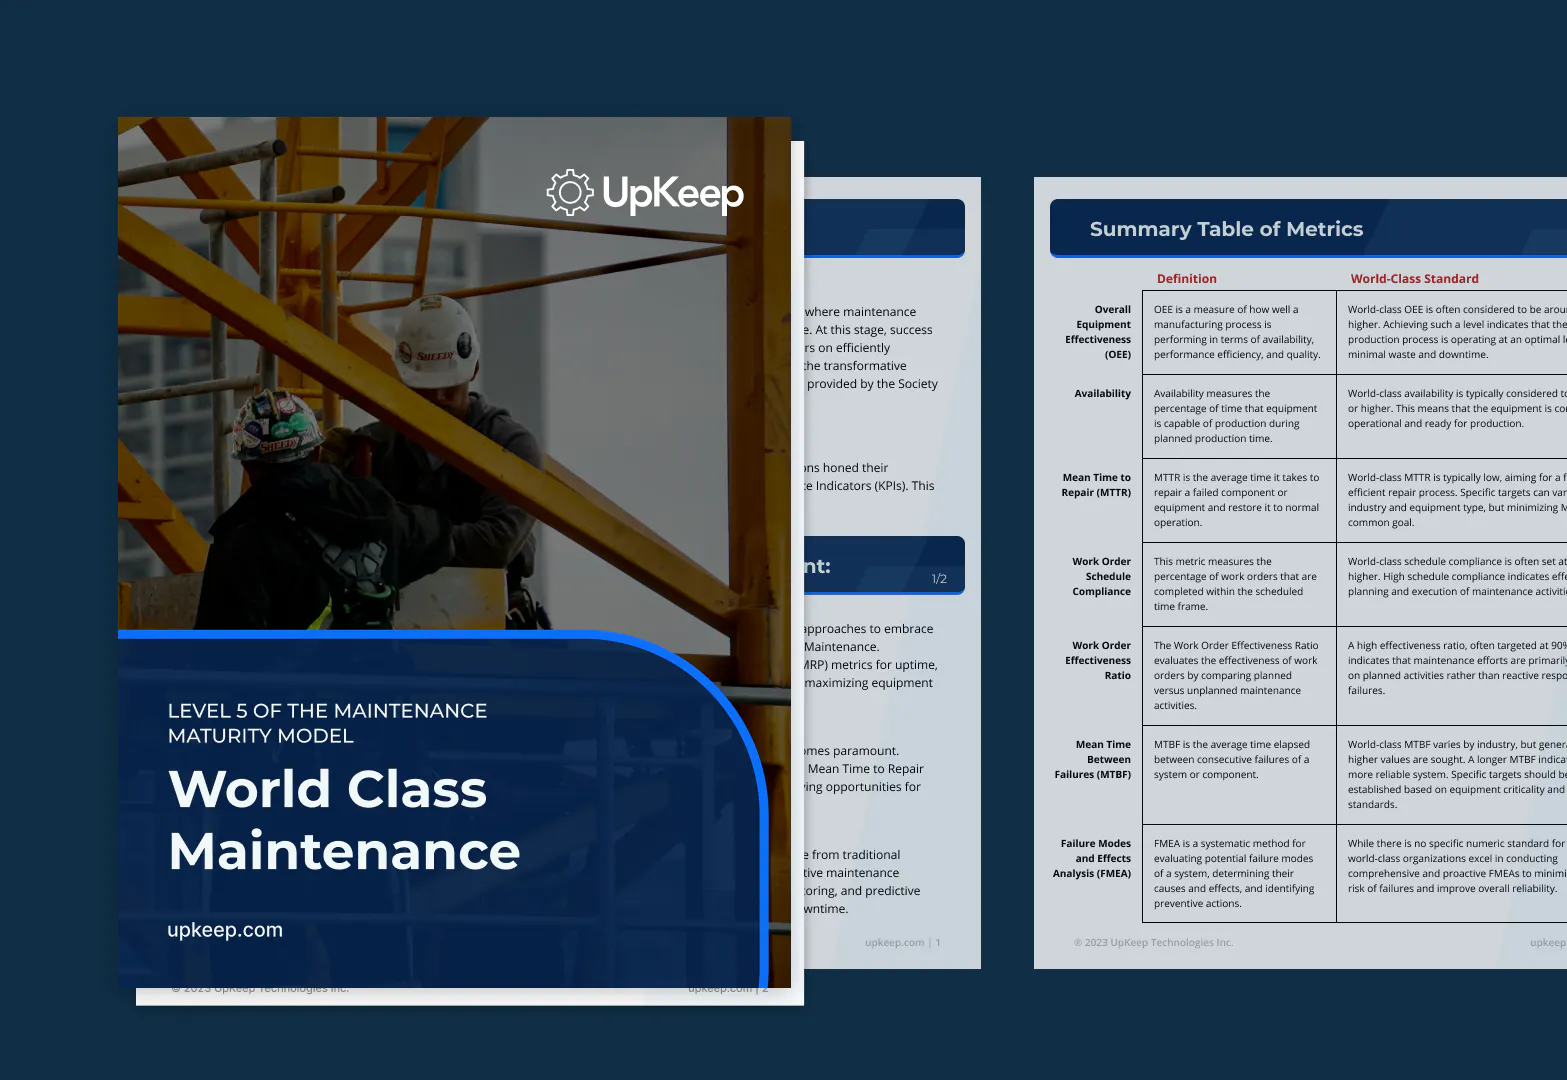
World Class Maintenance: Level 5 of the Maintenance Maturity Model
4,000+ Companies Rely on UpKeep's Asset Operations Management Software
Leading the Way to a Better Future for Maintenance and Reliability